
- 1. What a Supplier Scorecard Must Measure
- 2. How to Weight a Supplier Scorecard: 40 / 40 / 20
- 3. A Worked Example: Three Chassis Suppliers, One Quarter
- 4. What Each Sub-Score Tells You to Do
- 5. Turning a Supplier Scorecard into Order Allocation
- 6. Building the Scorecard in 12 Steps
- 7. Five Ways a Supplier Scorecard Fails
- 8. FAQ
- 8.1. How often should a supplier scorecard be run?
- 8.2. What is a realistic PPM target for cast polyurethane and rubber chassis parts?
- 8.3. Should OTIF or PPM carry the higher weight?
- 8.4. How do we score a supplier that ships through a trading company?
- 8.5. Can a small buyer run this without an ERP?
Supplier Scorecard: OTIF, PPM and Warranty Claim Rate
Supplier Scorecard: OTIF, PPM and Warranty Claim Rate
A supplier scorecard for chassis parts rests on three numbers: OTIF, PPM and warranty claim rate. Give each one a fixed formula, a fixed data source and a 1-5 band, weight delivery, quality and response 40 / 40 / 20, and let the score set order allocation in the same meeting.
Most scorecards fail for a duller reason than poor data. They are built as a report. A report is read, discussed and filed; the purchase order goes to whoever filed the lowest quote this quarter. The version described here is a decision table. Every row has a formula, every band has a threshold agreed before the first score, and the grade at the bottom of the page determines how much volume the supplier receives in the next quarter.
What a Supplier Scorecard Must Measure
Chassis parts are a difficult category to score because the economics and the timing pull in opposite directions. A polyurethane bump stop or a rubber bushing is a small line on the invoice, but a failed one arrives as a workshop complaint, a return freight bill or a warranty claim that arrives a year or more after the shipment that caused it. A scorecard that only measures what happens inside one quarter will grade a supplier on parts it made three quarters ago and miss the parts it is making now.
Three metrics cover the gap: OTIF for delivery, PPM for quality at receipt, and warranty claim rate for quality in service. Each answers a different question, and each has a blind spot that another metric has to cover.
| Metric | Formula | Where the data comes from | What the number hides |
|---|---|---|---|
| OTIF | Lines delivered complete inside the confirmed window ÷ total lines × 100 | PO confirmations and delivery notes | Early deliveries that break a production plan; partial lines counted as shipped |
| PPM | Rejected pieces ÷ pieces received × 1,000,000 | Incoming inspection and sorting records | Defects that appear only after assembly or in service |
| Warranty claim rate | Accepted claims ÷ units shipped in the matching period × 1,000 | Claim system keyed to the batch code | Failures the customer absorbs instead of claiming |
OTIF needs two definitions fixed in writing. The window is the date the supplier confirmed when it accepted the order, not the date the buyer first asked for. A supplier that confirms a later date and hits it has delivered on time; a supplier that accepts an impossible date and misses it has not, and the difference decides whether the metric measures reliability or optimism. Complete means the full line quantity. A shipment of 4,800 pieces against a line of 5,000 is a miss, because the buyer still has to chase the balance and the production plan still has a hole in it.
PPM needs a denominator that matches its numerator. Pieces received is the honest base; cartons and pallets flatter the number, and so does counting only the defects found at goods-in while the sorting hours at the buyer's warehouse go unrecorded. If a lot is sorted rather than rejected, the sorted-out pieces belong in the numerator. Otherwise the metric rewards suppliers whose defects are found late.
Warranty claim rate needs a lag. Claims do not arrive in the quarter that produced them. A part shipped in Q1 and claimed in Q3 belongs to Q1's production, so the denominator has to be the units shipped in the period the claims actually describe, not the units shipped this quarter. Buyers who skip this step watch the metric swing for reasons that have nothing to do with the supplier's current performance.
The claim window itself is set by the product, not by the scorecard. The specification for the Bonpora jounce bumper range states a design life of at least 80,000 km or 2 years under normal use, and the typical warranty in this market runs from 1 to 2 years or 50,000 to 100,000 km, with the exact term confirmed per order. Those figures define how long a claim stays live, and therefore how many months of shipment history the claim metric has to look back on.
How to Weight a Supplier Scorecard: 40 / 40 / 20
The split of 40 for delivery, 40 for quality and 20 for response suits a buyer who holds stock and sells into a repair market. Delivery and quality carry equal weight because in this category they cost roughly the same when they go wrong: a missed line empties a bin, and a bad lot fills a returns desk. Response sits at 20 because it is a multiplier on the other two rather than a result in its own right — a supplier that answers slowly will also close corrective actions slowly.
The weights should move with the business model, and only once. An OE customer running a sequenced line will push quality above delivery, because a stopped line costs more per hour than an expedited container. A distributor holding twelve weeks of stock can invert that and score delivery higher. What matters is that the weights are written down before the first score and frozen for four quarters. A scorecard whose weights change after the result is known is not a measurement; it is a justification.
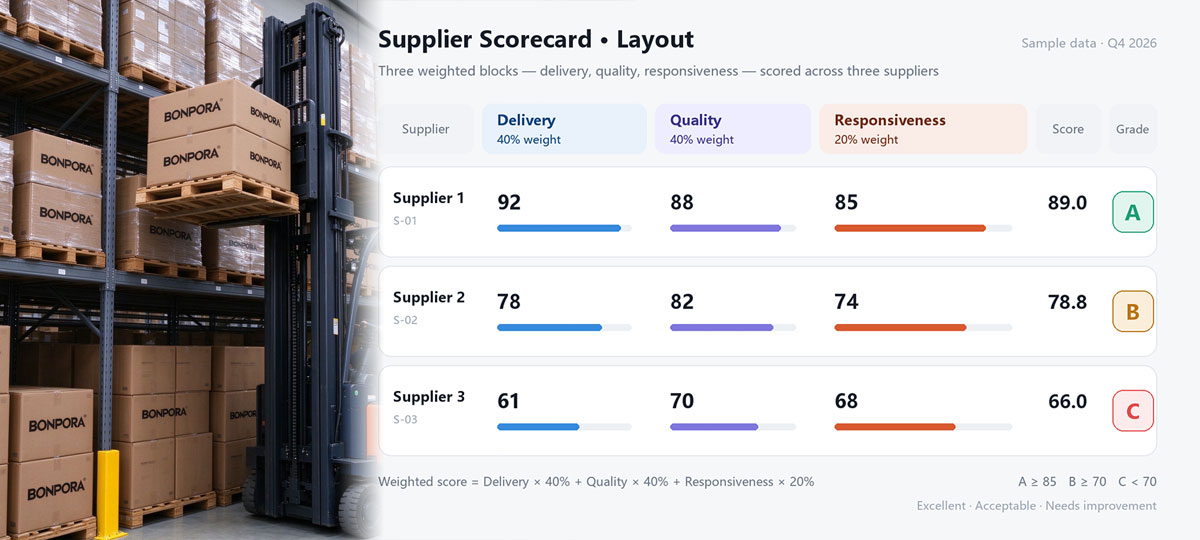
Each metric is converted to a 1-5 band before weighting. Bands are easier to defend in a supplier review than raw numbers, because a band states what the buyer considers acceptable rather than inviting an argument about a decimal place. The bands below are a starting point calibrated to a mixed OE and aftermarket book; they should be re-cut against your own twelve months of history before the first score is published.
| Metric | Weight | 5 | 4 | 3 | 2 | 1 |
|---|---|---|---|---|---|---|
| OTIF (%) | 25 | ≥98.0 | 95.0-97.9 | 90.0-94.9 | 80.0-89.9 | <80 |
| PO confirmation (days) | 8 | ≤2 | 3-4 | 5-7 | 8-12 | >12 |
| Packaging accuracy (complaints per 100 shipments) | 7 | ≤1.0 | 1.1-2.0 | 2.1-4.0 | 4.1-8.0 | >8.0 |
| PPM | 20 | ≤1,000 | 1,001-2,500 | 2,501-5,000 | 5,001-15,000 | >15,000 |
| Warranty claim rate (per 1,000 units) | 12 | ≤4.0 | 4.1-8.0 | 8.1-15.0 | 15.1-30.0 | >30 |
| Documentation (PPAP elements and certificate scope) | 8 | Full set, scope covers the part | Current, minor gaps | PPAP incomplete | Scope mismatch | No valid certificate |
| 8D closure (days to verified close) | 10 | ≤14 | 15-21 | 22-30 | 31-45 | >45 |
| Quotation turnaround (days) | 10 | ≤2 | 3-4 | 5-7 | 8-12 | >12 |
Documentation carries a weight of 8 rather than a veto of its own, because it measures the system behind the product. A certificate is only evidence when its scope names the part family and the site that makes it, which is the point of the IATF 16949 vs ISO 9001 comparison; a certificate that covers a different plant is worse than no certificate, because it looks like assurance.
If the scoring model is the part you need to align rather than the supplier, the same four inspection items that a factory runs under IATF 16949 — static stiffness curve, compression set, hardness and appearance — are the records a scorecard should be sampling. You can request a specification sheet and a sample against your reference numbers and check the measurement basis before the bands are set.
A Worked Example: Three Chassis Suppliers, One Quarter
Three suppliers of the same bump stop family, one quarter, scores built from the table above. The figures are illustrative, but the arithmetic is the arithmetic any buyer will run.
| Metric | Supplier A | Supplier B | Supplier C |
|---|---|---|---|
| Order lines | 1,240 | 860 | 420 |
| OTIF | 96.8% (4) | 97.2% (4) | 78.6% (1) |
| PO confirmation | 2 days (5) | 2 days (5) | 9 days (2) |
| Packaging complaints | 1.2 per 100 (4) | 1.8 per 100 (4) | 6.5 per 100 (2) |
| PPM | 480 (5) | 1,900 (4) | 20,000 (1) |
| Warranty claim rate | 5.7 per 1,000 (4) | 9.4 per 1,000 (3) | 41.0 per 1,000 (1) |
| Documentation | Full set (5) | Minor gaps (4) | Scope mismatch (2) |
| 8D closure | 12 days (5) | 18 days (4) | 52 days (1) |
| Quotation turnaround | 3 days (4) | 5 days (3) | 14 days (1) |
| Weighted score | 89.2 | 77.2 | 24.6 |
The weighted score is the sum of each weight multiplied by its band, divided by 5. Supplier A: 25×4 + 8×5 + 7×4 + 20×5 + 12×4 + 8×5 + 10×5 + 10×4 = 446, and 446 ÷ 5 = 89.2. Supplier B reaches 386 for 77.2, Supplier C 123 for 24.6.
The interesting column is B. Its OTIF is marginally better than A's, and a buyer who scores delivery alone would see two equivalent suppliers. The difference sits in the two numbers that arrive late: PPM at 1,900 against 480, and a claim rate at 9.4 per thousand against 5.7. Those are the numbers that cost money after the invoice is paid.
Put a price on the gap. B quotes 0.12 USD per unit below A. At 40,000 units a year that is 4,800 USD of apparent saving, against:
Excess claims: (9.4 − 5.7) ÷ 1,000 × 40,000 = 148 claims at 18.70 USD each = 2,768 USD.
Incoming inspection: B's PPM band requires tightened sampling, budgeted at 0.06 USD per unit × 40,000 = 2,400 USD.
Slower corrective action: 18 days against 12, two issues a year, 6 days of buyer engineering time at 85 USD a day = 1,020 USD.
Total 6,188 USD against a 4,800 USD saving, so B is 1,388 USD more expensive in the year despite the lower quote. The break-even discount is 6,188 ÷ 40,000 ≈ 0.155 USD per unit. Any quote gap below roughly 0.16 USD per unit does not pay for the score difference, and that single number is usually more persuasive in a sourcing meeting than the score itself.
What Each Sub-Score Tells You to Do
A total score ranks suppliers. The pattern of sub-scores tells you what to fix, and the pattern is often more useful than the rank.
| Pattern | Likely cause | First action |
|---|---|---|
| OTIF low, PPM and claims healthy | Capacity or planning, not process | Move to a rolling forecast with a firm order window; review capacity, not quality |
| OTIF high, PPM high, claims low | The factory measures to a different standard than the buyer's goods-in | Compare the method: hardness test location on the part, fixture for the stiffness curve, sample size per lot |
| PPM low, claim rate high | Escapes that only appear in service: set, cracking, bond failure | Ask for the compression set and stiffness curve records for the affected lots and check the post-cure window |
| All three healthy, 8D slow | Weak problem solving rather than a weak product | Tie new RFQs to closure time; the next failure is the one that matters |
| Quotation fast, documentation thin | Commercial responsiveness ahead of system maturity | Verify certificate scope and site before adding volume |
The second row is the one buyers misread most often. Two measurement systems that disagree will produce a supplier who passes its own inspection and fails yours, and the argument that follows is about gauges rather than about quality. The cure is a correlation run on a shared set of parts, not a tougher acceptance rule.
Turning a Supplier Scorecard into Order Allocation
Grades are read off the weighted score, and each grade carries an allocation rule agreed in advance.
A, 85 and above. Up to 60-70% of category volume, first call on new references, eligible for tooling investment.
B, 70 to 84.9. 30-40% of volume, an improvement plan with two named metrics and a review date, no new tooling without approval.
C, below 70. No new orders; existing orders continue only with tightened incoming inspection and batch retention, and an alternative source is qualified in the same quarter.
Two rules sit above the grade. The first is a cap: a lapsed certificate, a scope that does not name the site, or a field failure traced to a skipped process step caps the supplier at C regardless of the total, because an average will hide a single disqualifying fact. The second is that allocation moves in the meeting where the score is presented. A scorecard that produces a grade but leaves the next PO untouched teaches everyone in the room that the exercise is administrative.
Building the Scorecard in 12 Steps
Fix the review period: four rolling quarters for context, the latest quarter for action.
Write the OTIF window as the confirmed date at order acceptance, and define complete as full line quantity.
Set the PPM unit as pieces received, and include sorted-out pieces in the numerator.
Build the claim denominator from shipments in the period the claims describe, not the current quarter.
Map every claim to a part number, a position and a batch code before scoring, so the rate can be read by product.
Publish the weights for the four metrics groups and freeze them for four quarters.
Convert every metric to a 1-5 band, with the threshold written next to it.
Score documentation separately from product quality; a certificate is system evidence, not part evidence.
Add one cost line for sorting and rework hours charged back, so the score has a currency value.
Send the supplier the underlying lines, not only the total; disputes about a total cannot be resolved.
Agree the A/B/C allocation rules with purchasing and sales before the first score is issued.
Review allocation in the same meeting, and record the volume change next to the grade.
Five Ways a Supplier Scorecard Fails
The average swallows a hard fail. A supplier with a lapsed certificate and strong delivery scores in the seventies and keeps the volume. The cap rule exists for this.
The easy metrics get measured. Price and lead time are already in the ERP; claims data is messy and lives in another system. A scorecard built on what is convenient grades the wrong thing.
The weights move after the result. Adjusting a weight to justify a decision already taken destroys the next four quarters of credibility.
The claim lag is ignored. Scoring this quarter's claims against this quarter's shipments makes a good supplier look worse every time volume grows.
The score is published without the data. A supplier who cannot see the lines behind the number will argue the number, and the conversation never reaches the cause.
FAQ
How often should a supplier scorecard be run?
Quarterly, with the rolling four-quarter view kept for context. Monthly scoring produces noise in a category where claims lag shipments by months, and annual scoring is too slow to change an allocation before the season. The action list should be short enough to review in one meeting.
What is a realistic PPM target for cast polyurethane and rubber chassis parts?
It depends on whether the PPM counts only goods-in rejects or also the parts sorted out later, and the two definitions differ by a factor that makes published benchmarks hard to compare. Set the first target from your own twelve months of history, then tighten it by one band per year while the supplier holds the grade.
Should OTIF or PPM carry the higher weight?
Neither, in the default 40 / 40 / 20 split. Move the balance only for a structural reason: a sequenced OE line justifies more quality weight, a distributor holding deep stock justifies more delivery weight. Changing the split between two suppliers in the same category is what makes a scorecard indefensible.
How do we score a supplier that ships through a trading company?
Score two entities on one sheet. The certificate and the plant belong to the manufacturer, and the OTIF, quotation and 8D behaviour belong to whoever signs the contract. If the trading company cannot produce the manufacturer's certificate with the correct site and scope, the documentation band drops regardless of how well the shipments perform.
Can a small buyer run this without an ERP?
Yes. Twelve months of purchase orders, packing lists and inspection records in a spreadsheet will carry twenty to thirty order lines per supplier, which is enough for the bands to mean something. The work is in the definitions, not the software; a correct OTIF definition in a spreadsheet beats a wrong one in a dashboard.
A supplier scorecard earns its place when it changes a purchase order. Three metrics, eight weighted lines, five bands and a grade that moves volume — that is the whole structure, and it can be running before the next quarterly review with records most buyers already hold. The Bonpora jounce bumper range publishes the inspection basis a quality score should be sampling, and the buyer guides for suspension sourcing collect the working documents that sit around it.
Get a quotation with your reference numbers, annual volumes and the metrics you score, and the reply can be structured around the numbers your scorecard actually measures.
- Prev.:Why Cheap Bump Stops Fail in Warranty: Seven Buyer Mistakes
- Next.:Steel Shims: Size Chart, Materials and Applications for Bike, Motorcycle, Passenger Car, Off-Highway and 4x4